A breakthrough for real-time monitoring of electrical panel boards
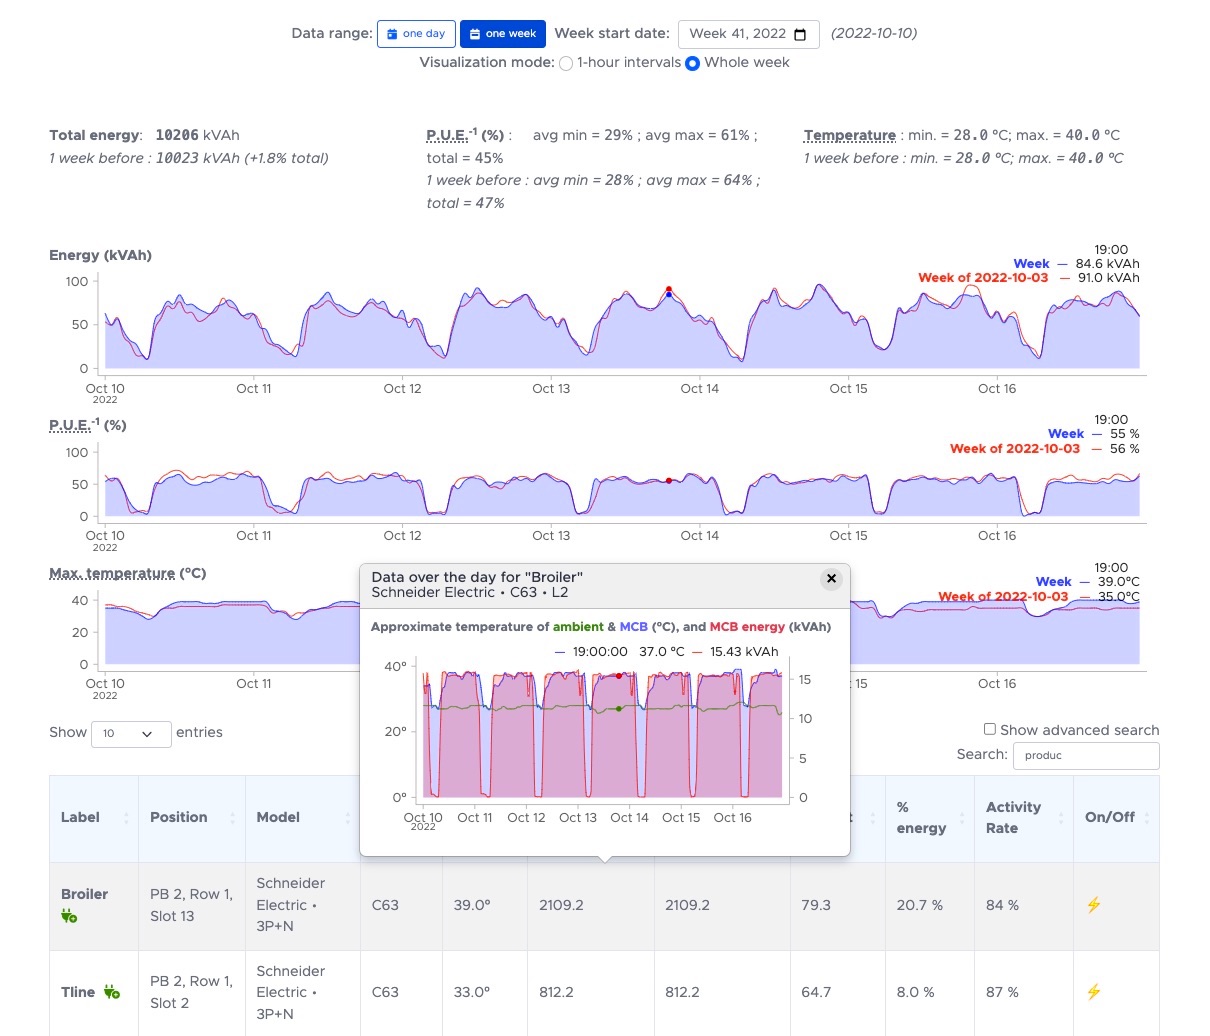
Monitor the values and deviation of individual breaker consumption.
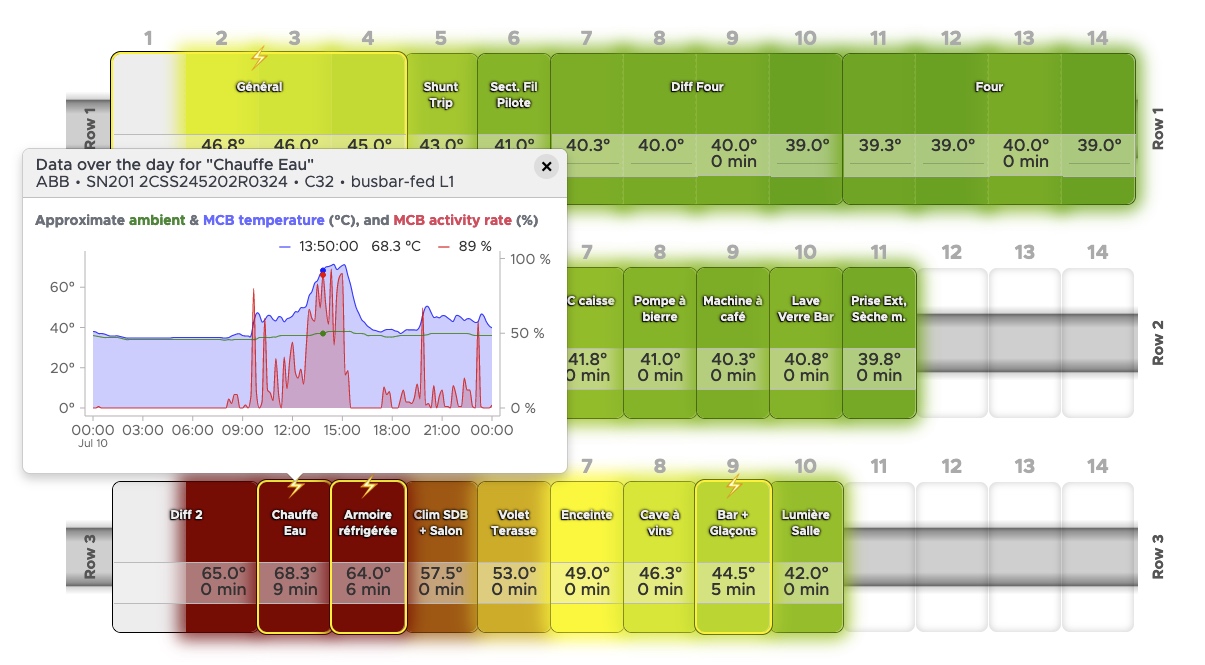
Capture breakers' temperature and optimize on-site maintenance resources, slashing the costs.


Monitor the values and deviation of individual breaker consumption.
Capture breakers' temperature and optimize on-site maintenance resources, slashing the costs.

Installation and implementation far from the costly and complex traditional energy measurement solutions.
Accelerate your savings and maintenance now!


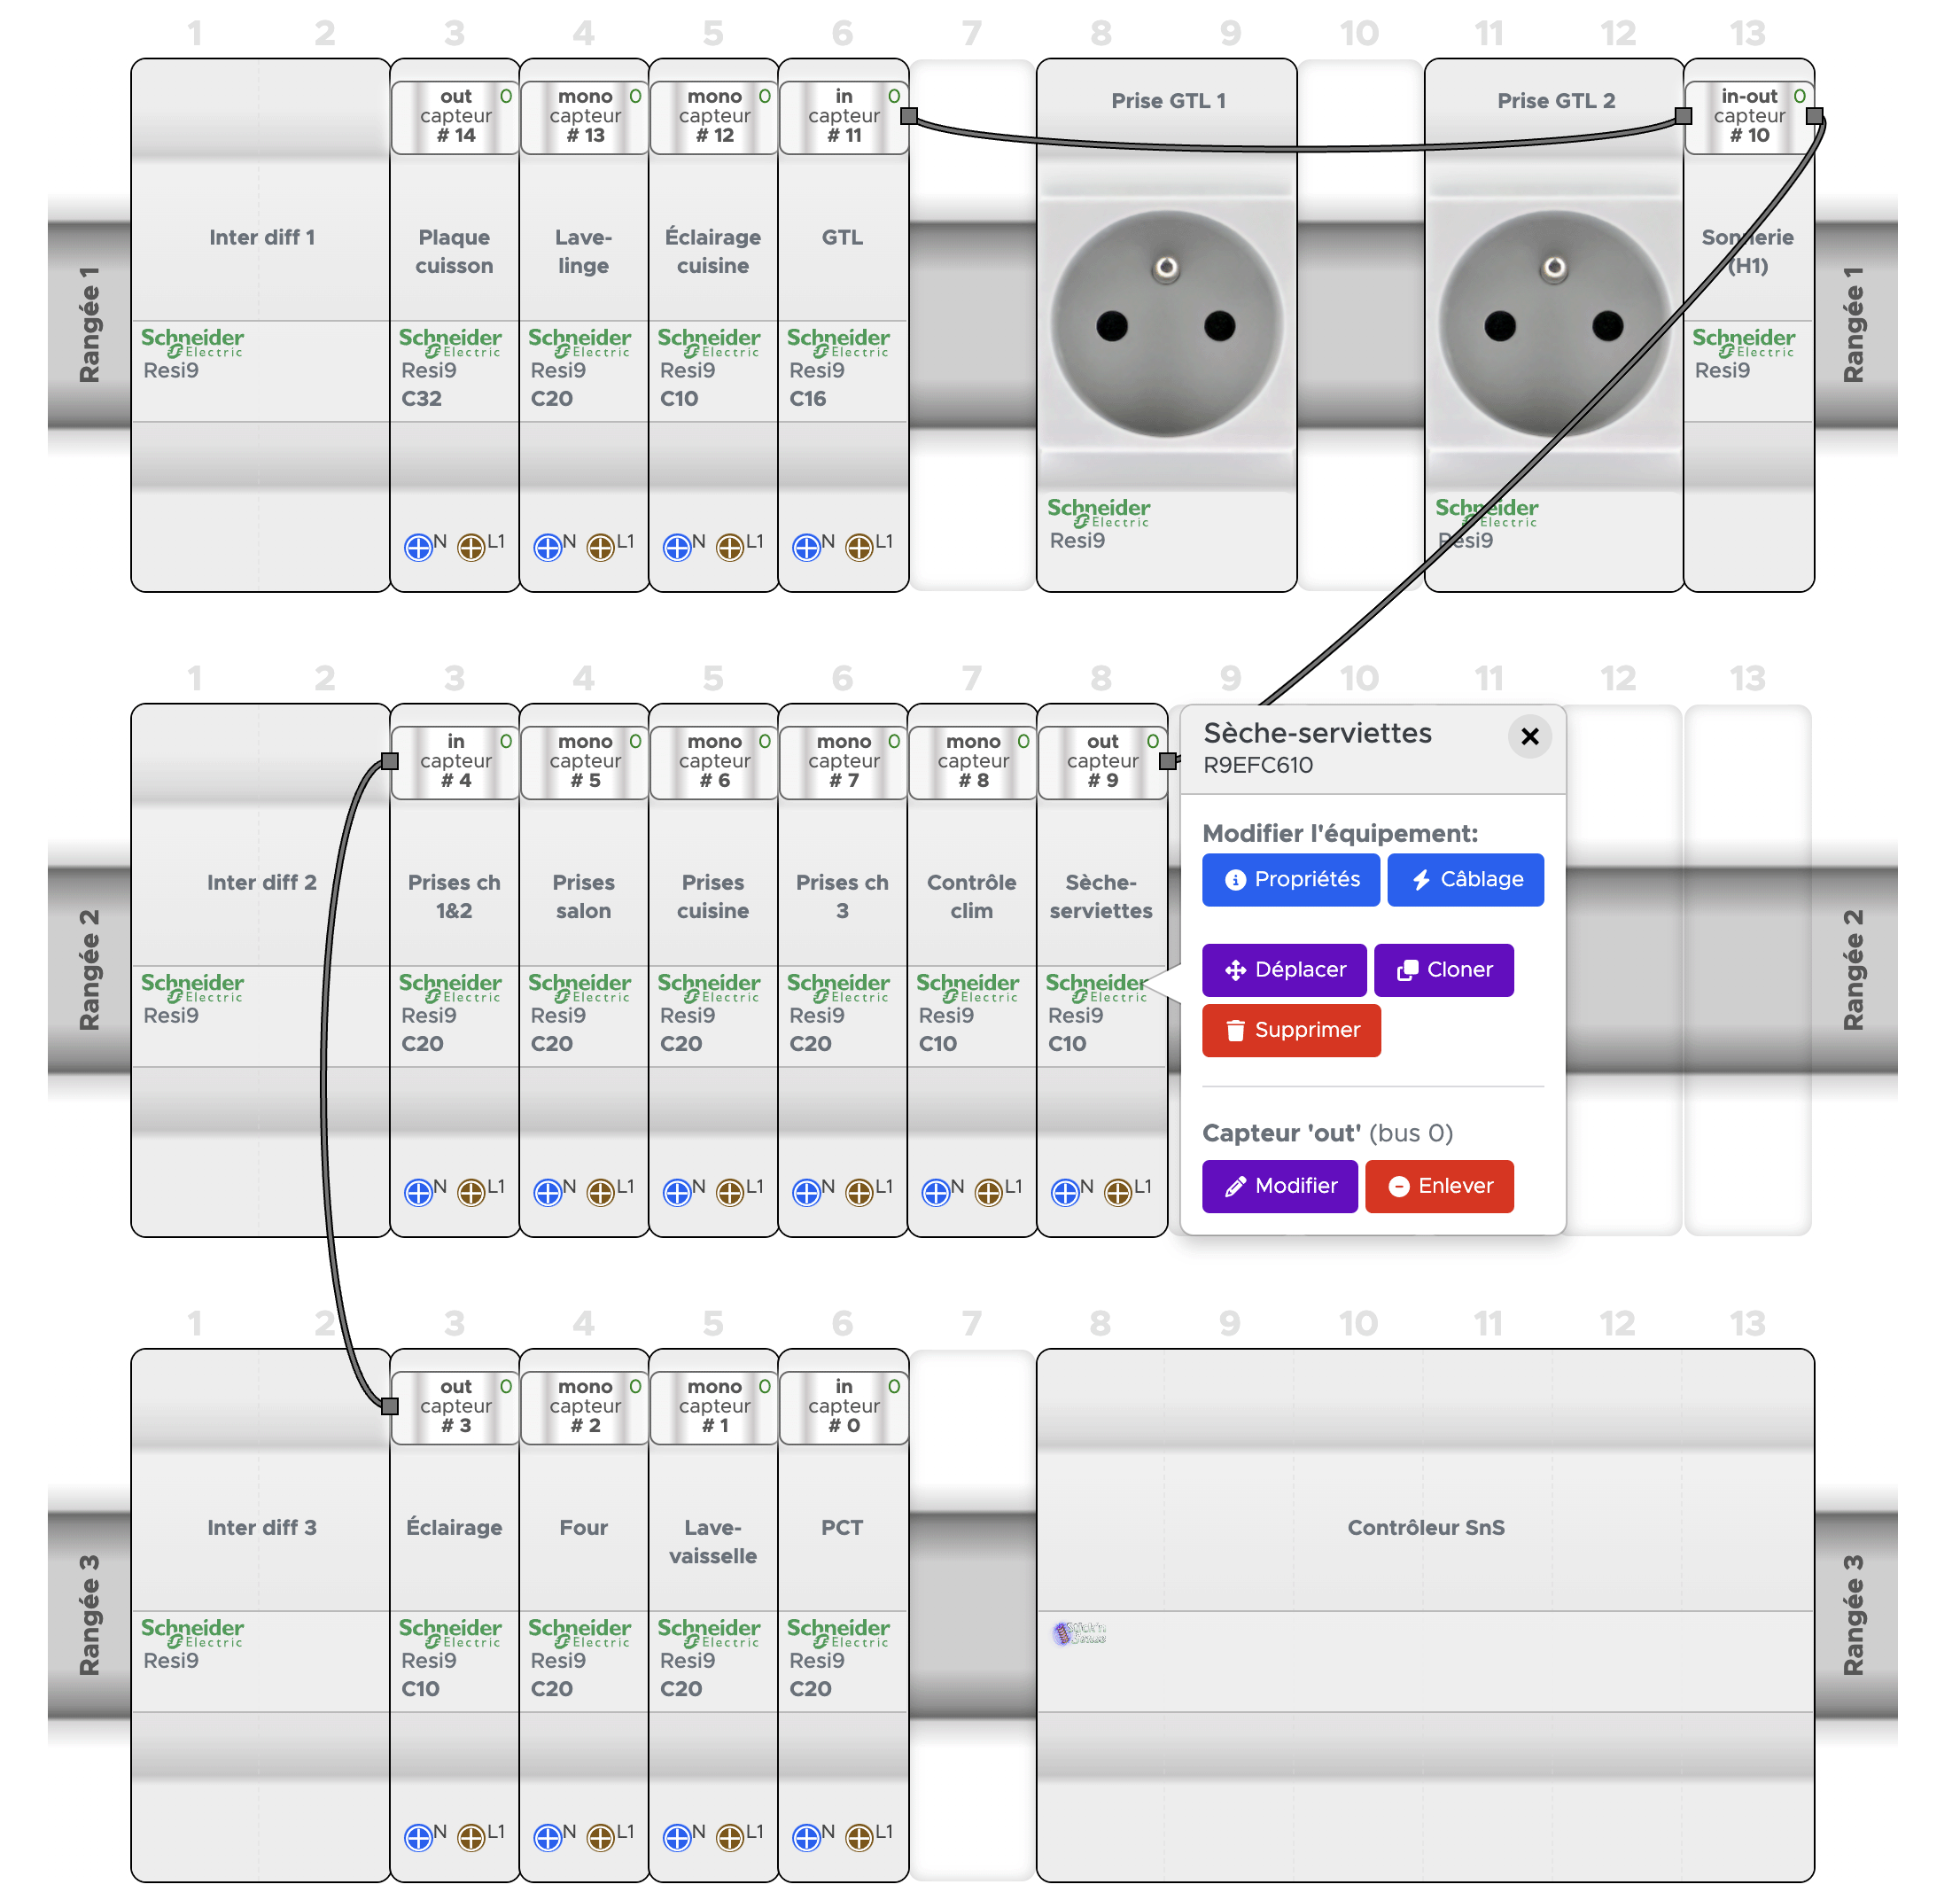
Installation tools allow quick and simple system installation & commissioning, without turning the power off

PanelWatch® - a breakthrough for electric panel boards monitoring
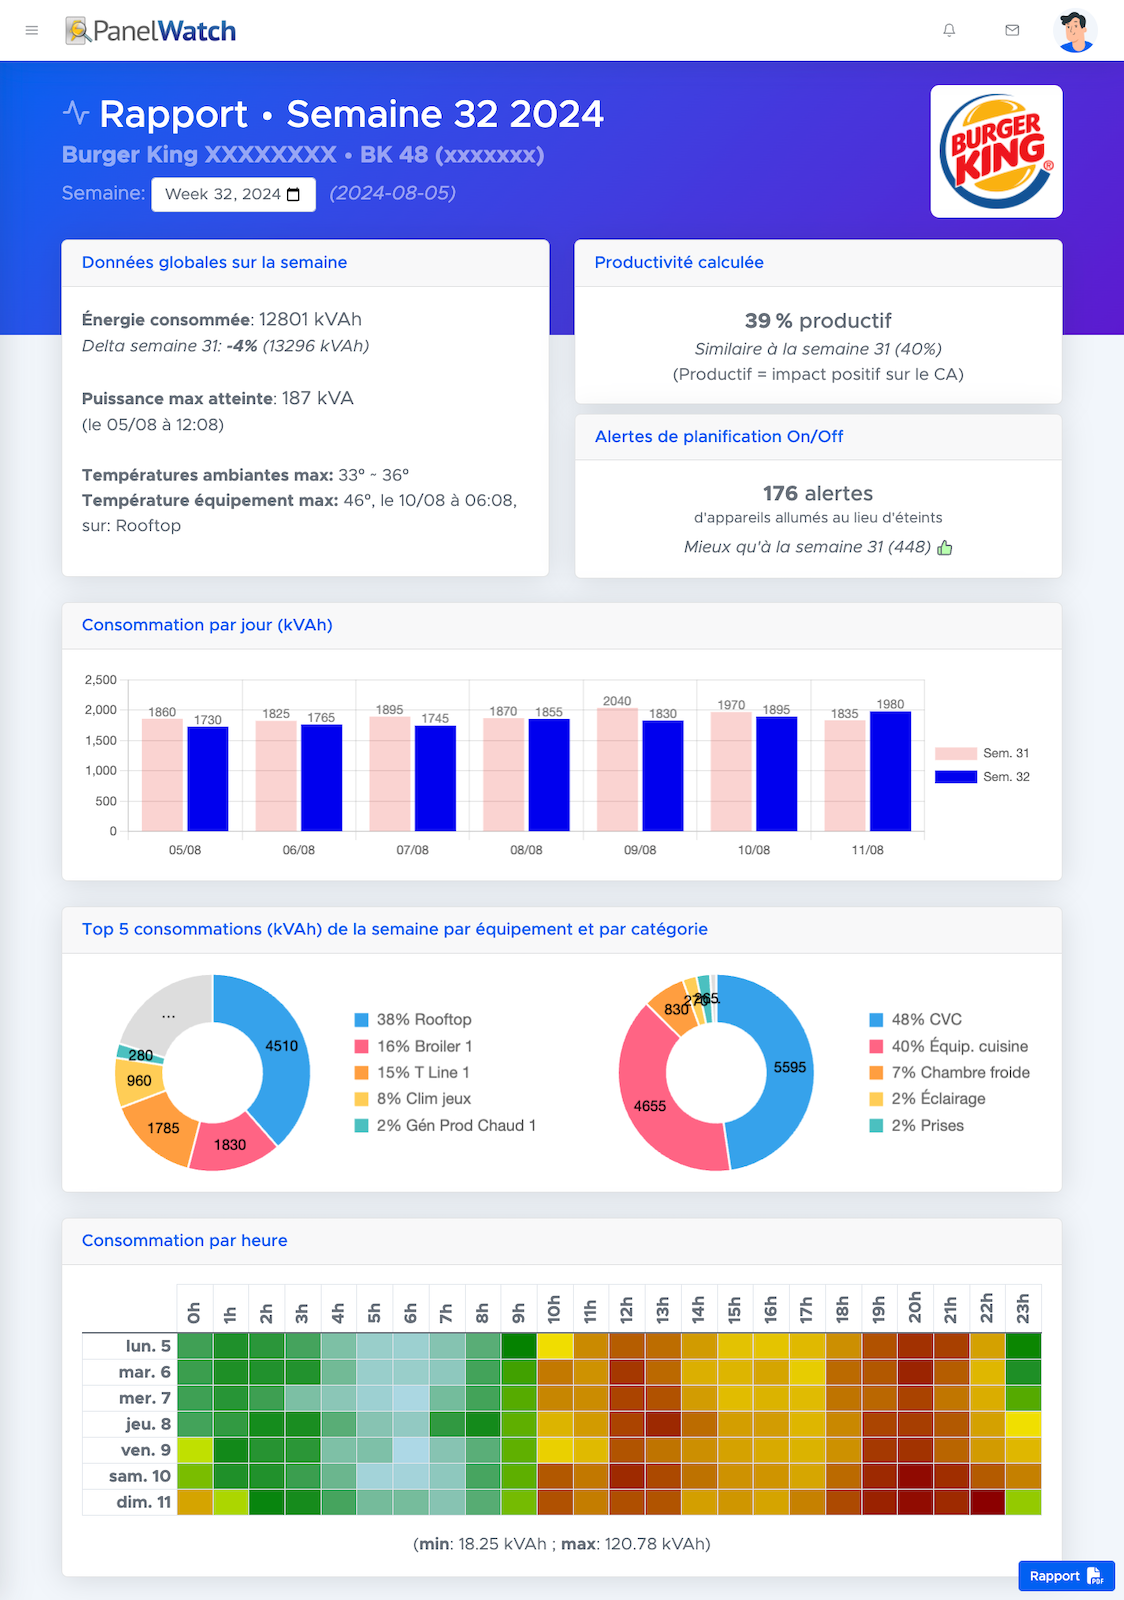
To have an overall vision of the week or month.
Can be set up to be periodically sent by e-mail.

Up to 280 breakers can be monitored with one sensor controller which is way more than the usual number of breakers in typical panelboards.
No! Stick'n Sense are passive and totally non-intrusive. They can be installed by a certified electrician without interrupting normal site operation.
Monitoring breakers' temperature is essential to prevent excessive temperature. Too much heat can be the sign of either breaker rating undersizing, or of a faulty device drawing too much current, or worse, of the presence of an electric arc precursor of a fire outbreak. In all cases, untimely shutdowns of the installation can occur, causing damage to property and sometimes unfortunately to people. Business losses from electrical fires reach billions of dollars.
We designed PanelWatch® to monitor the temperature of all breakers and to trigger alerts when the thermal behavior of breakers becomes abnormal.
PanelWatch® uses patented algorithms for measuring and monitoring breakers temperature and consumption.
PanelWatch® does not compare to sub-metering, and does not claim the same accuracy as expensive metrology-grade systems. On the other hand, it does not require modifying the electrical panel: it is installed without switching off the installation, and of course, is much less expensive with an ROI usually observed in less than one year. In addition, it gives you access to the temperature of the circuit breakers, thus slashing maintenance costs and helping to prevent fires.